Today's algorithmic
composition tutorial uses sonification as a composition tool. Sonification
uses data that is typically not musical and involves remapping this to
musical parameters to create a composition.
Sonification can be used to hear information in a set of data that might be otherwise difficult to perceive, common examples include Geiger counters, sonar and medical monitoring [ECG]. When creating sonification algorithmic compositions we are interested in creating interesting or aesthetically pleasing sounds and music by mapping non-musical data directly to musical parameters.
Sonification can be used to hear information in a set of data that might be otherwise difficult to perceive, common examples include Geiger counters, sonar and medical monitoring [ECG]. When creating sonification algorithmic compositions we are interested in creating interesting or aesthetically pleasing sounds and music by mapping non-musical data directly to musical parameters.
Here is some example output:
The Sonification Process:
There are four simple steps involved in creating a sonification composition.
1. Find some interesting data
1. Find some interesting data
2. Decide
which musical parameters you want to map the data to
3. Fit
the input data to the correct range for your chosen musical parameters
(normalise)
4. Output
remapped data to MIDI synths, audio devices etc
Step 1 – Find an interesting set of data
First of all we need to
source a data set. You can use any data you like stock markets, global
temperatures, population changes, census data, economic information, record
sales, server activity records, sports data - any set of numbers you can lay
your hands on, here are some possible sources: Research
portal, JASA data, UK govt data,
It's important to select
your source data carefully. Data that has discernable patterns or interesting
contours works particular well for sonifications. Data that is largely static
and unchanging will not be interesting, similarly data that is noise-like is
usually of limited use.
Here we've loaded some example data into a coll object in PureData
And similarly in Max:

Here we've loaded some example data into a coll object in PureData
And similarly in Max:

Step 2 - Map Data to
Musical Parameters
The second step is the most creative of the sonification process. It involves making creative decisions about which musical parameters to map the data to e.g. pitch, rhythm, timbre and so on.
This is more of an involved question than it initially appears, if we choose to map our data to pitch, we also have to choose how these pitches will be represented:
This is more of an involved question than it initially appears, if we choose to map our data to pitch, we also have to choose how these pitches will be represented:
Frequency (20Hz - 20kHz): this is useful for direct control of synths, filter cutoffs etc, but is not intuitively musical and typically needs conversion if working with common musical scales
MIDI notes (0 - 127): assumes 12 note division of the octave, no representation of C# versus Db
MIDI cents
• OpenMusic uses a MIDIcents representation. This
is equivalent to MIDI notes * 100 so middle c is 6000
• This enables microtonal music and alternative
divisions of the octave, for example dividing the octave into 17.
Pitchclass
• octaves are equivalent
Scale degree
• Assumes use of a scale and returns the degree of
that scale.
• This is useful as we can easily deal with uneven
steps in the scale simply
Step 3 – normalise data
to fit musical parameters
In Max we can use the scale
object. Scale maps an input range of float or integer values to an output
range. The number is converted according to the following expression
y = b e-a c x c
where x is the input, y is
the output, a, b, and c are the three typed-in arguments, and e is the base of
the natural logarithm (approximately 2.718282).
expr $f4 + ($f1 - $f2) *
($f5 - $f4) / ($f3 - $f2 )
1 = number
2 = input min
3 = input max
4 = output min
5 = output max
Step 4 – Output
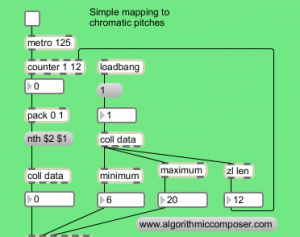
Adding in some MIDI objects allows us to hear our data sonified in a simple way: And in PureData adding in a makenote and noteout objects and normalising our output data to one octave of a chromatic scale looks like this.
You should now have some basic musical output to your MIDI synth. Now
the patch is setup it’s easy to experiment with mapping the data to
different pitch ranges. For example:
- Try adjusting the normalisation (the scale object in Max or expr object in PureData) to map the data across two octaves instead of one by changing the output range from 12 to 24 – or any other pitch range.
- The + 60 object sets our lowest pitch as MIDI note 60, this can be modified easily to set a different pitch range.
- Invert the data range by having a high output minimum and a lower maximum, so ascending data creates descending melodic lines.
Mapping to Scales
As an alternative to mapping our data to chromatic pitches we can
use a different pitch representation and map our scale to the notes of a
diatonic scale.
First we need to define a few scales in a table in Max:

As the contents of tables are defined slightly differently in PureData this looks like this:

The above screenshots show the scale intervals for a Major,
Harmonic Minor, Melodic Minor and Natural Minor scale being stored in a
separate table for each scale. These are stored as pitchclasses, if we
need to transpose or modulate our composition to another key we can add
or subtrack to these scale notes before the makenote object e.g. to transpose up a tone to D add a + 2
object. Now rather than mapping to chromatic pitches we’ll map to scale
pitches so we’ll need to modify our normalisation to reflect this.

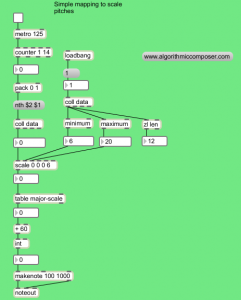
Here we’ve changed the output range to be 0 to 6 to reflect the seven different scale degrees of the major scale. Similarly in Max:

We are now mapping our octave to a major scale, as we have already
stored a number of scales you could try changing the name of the table
that is being looked up to map to an alternative scale e.g. table harmonic-minor-scale.
We can also map the data to a scale over more than one octave.

Here we’ve changed the output range in this example to be 0 to 20.
Using % (modulo) to give us the individual scale degrees and / (divide)
to give us the octave. The process is the same in Max, although in the
previous example we mapped across 3 octaves of the scale there’s no
requirement to map to full octaves, you could map your data to 2 1/2
octaves or any other pitch range by changing the output values of the scale object (expr in PureData):

So far we have mapped our data to MIDI pitches. The next example
maps the data to frequencies and uses this to control the cutoff
frequency of a band pass filter that is fed with noise. This gives a
sweeping windsound effect.
As an alternative to MIDI output
we’ll map our wind data to the filter cutoff of a bandpass filter that
is fed with noise. As we’re know working with frequencies rather than
MIDI notes we’ve changed the output of the scale object to remap any incoming data between 200Hz and 1200Hz:

The patch is setup in a very similar way in PureData with a bp~ object as our band pass filter, rather than the reson~ object found in MaxMSP.

Although all of the notes are created by mapping the data directly
to pitches we have made another of creative decisions along the way, so
there are many ways of realising different sonifications of the same
source data. So far we have only mapped to pitch however we still have a
number of variables we can alter:
scale – chromatic, major, melodic minor, natural minor, harmonic minor (any other scales can be defined easily)
base pitch (the lowest pitch )
pitch range (range above our lowest pitch e.g. 2 octaves)
the data set used to map to pitches
As with any composition we also have to make musical decisions
concerning which instrument plays when, timbres and instrumentation,
dynamics, tempo etc. In another post we’ll look at sonifying these
elements from data but for now we’ll make these choices based on
aesthetic decisions.
Summary
In the youtube example we have added several copies of the sonification
patch so we have one for each of our data sets (temperature, sunshine,
rainfall and windspeed). The interesting thing about using weather data
is that we should hear some relationship between the four sets of data.
We’ve also added a score subpatch with sends and receives to turn
on and off each section and control the variables mentioned above (min
pitch, pitch range etc).
You can download the PureData sonification patch here.
You can download the Max sonification patch here.
After the getting the patch to work play around with your own settings and modifications and check out part two of this sonification algorithmic composition tutorial.
Future posts will continue the idea of mapping and explore sonifying
rhythm, timbre and other musical parameters. Have fun and feel free to
post links to your sonification compositions below.Post a comment if you’ve any questions on this patch.


No comments:
Post a Comment